Lesson Plan/Activity
Lesson Plan: Analyzing the Rise of U.S. Wildfires
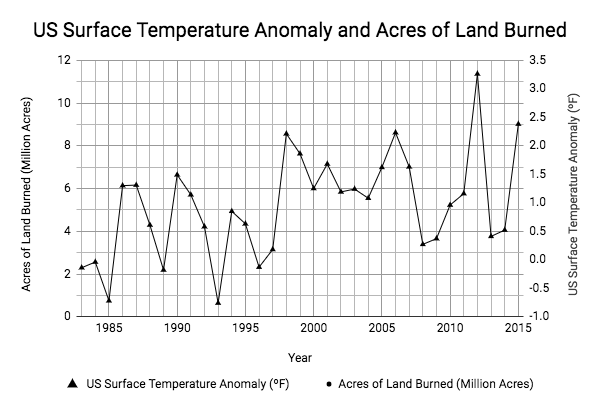
In this activity, students graph the acres burned by wildfires across the U.S. by year and compare the trend to that …
In this activity, students graph the acres burned by wildfires across the U.S. by year and compare the trend to that …

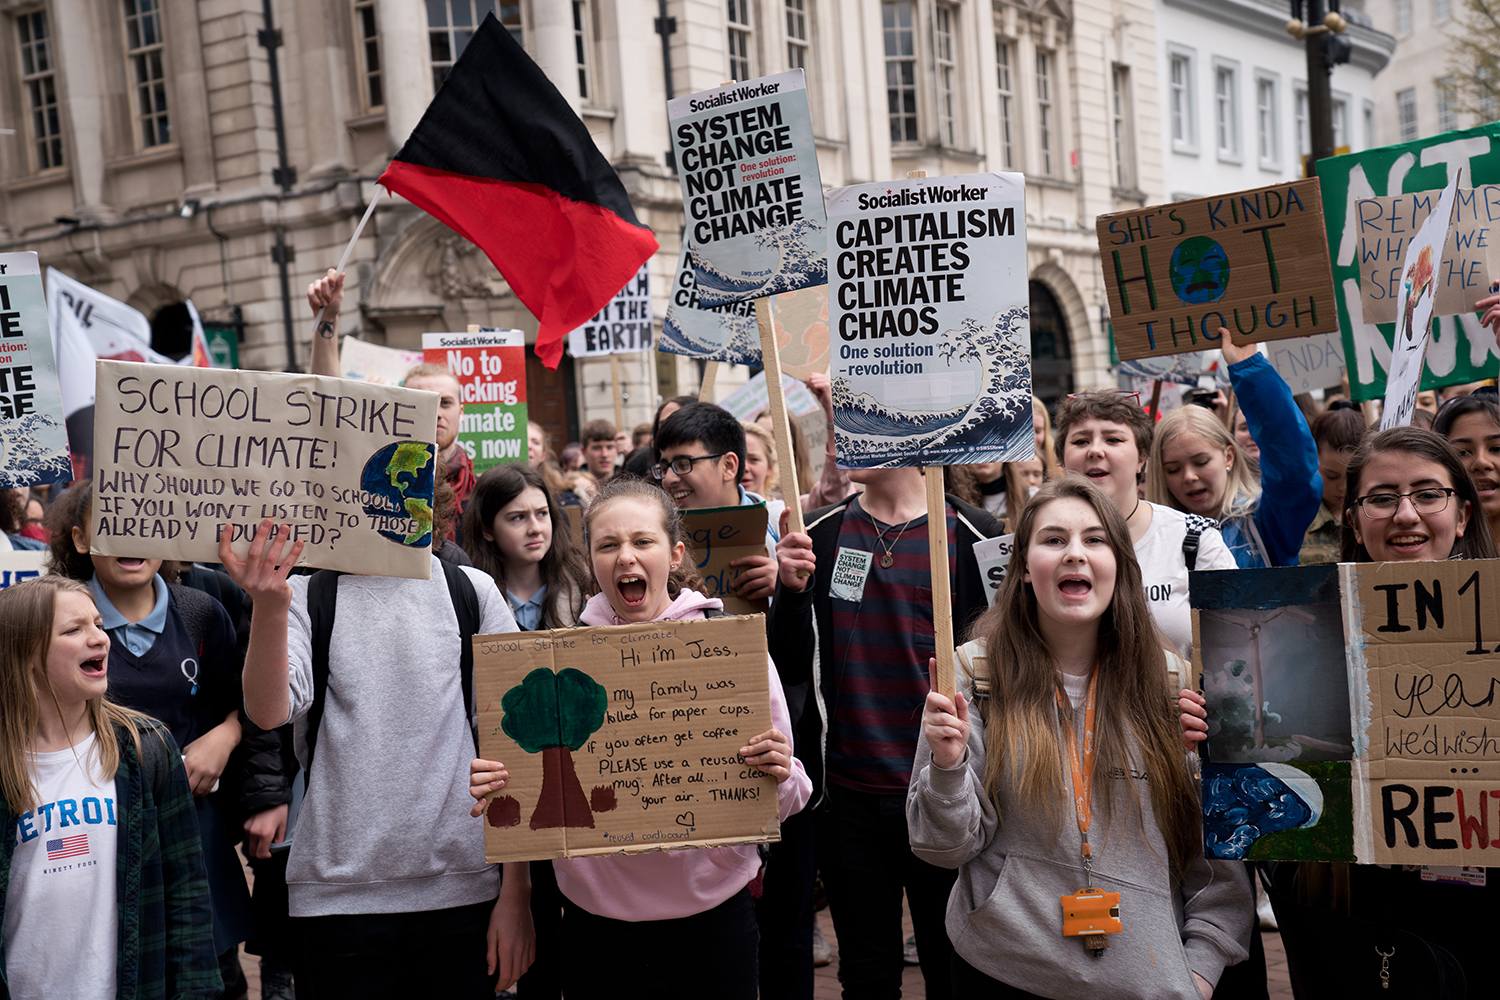
This is a unique opportunity for us as educators to use this pivotal moment to empower and support our students in …

In this lesson, students analyze the environmental burden and population demographics of different neighborhoods in Chicago using an interactive map. Students …
This lesson introduces students to the concept of climate justice through trivia, intersectional issue mapping, and a group activity to learn …
In this lesson, students will explore some of the local climate impacts of their state and write a personal narrative to …

Background This webinar, held on October 1, 2019, introduces teachers to ACE’s climate education resource, Our Climate Our Future. Webinar host …
In this lesson, students interact with the National Climate Assessment chapter on agriculture to learn about the multiple ways that agricultural …
In this problem-based learning exercise, students become community members of the town of Belleville, a fictional town in North Carolina where …
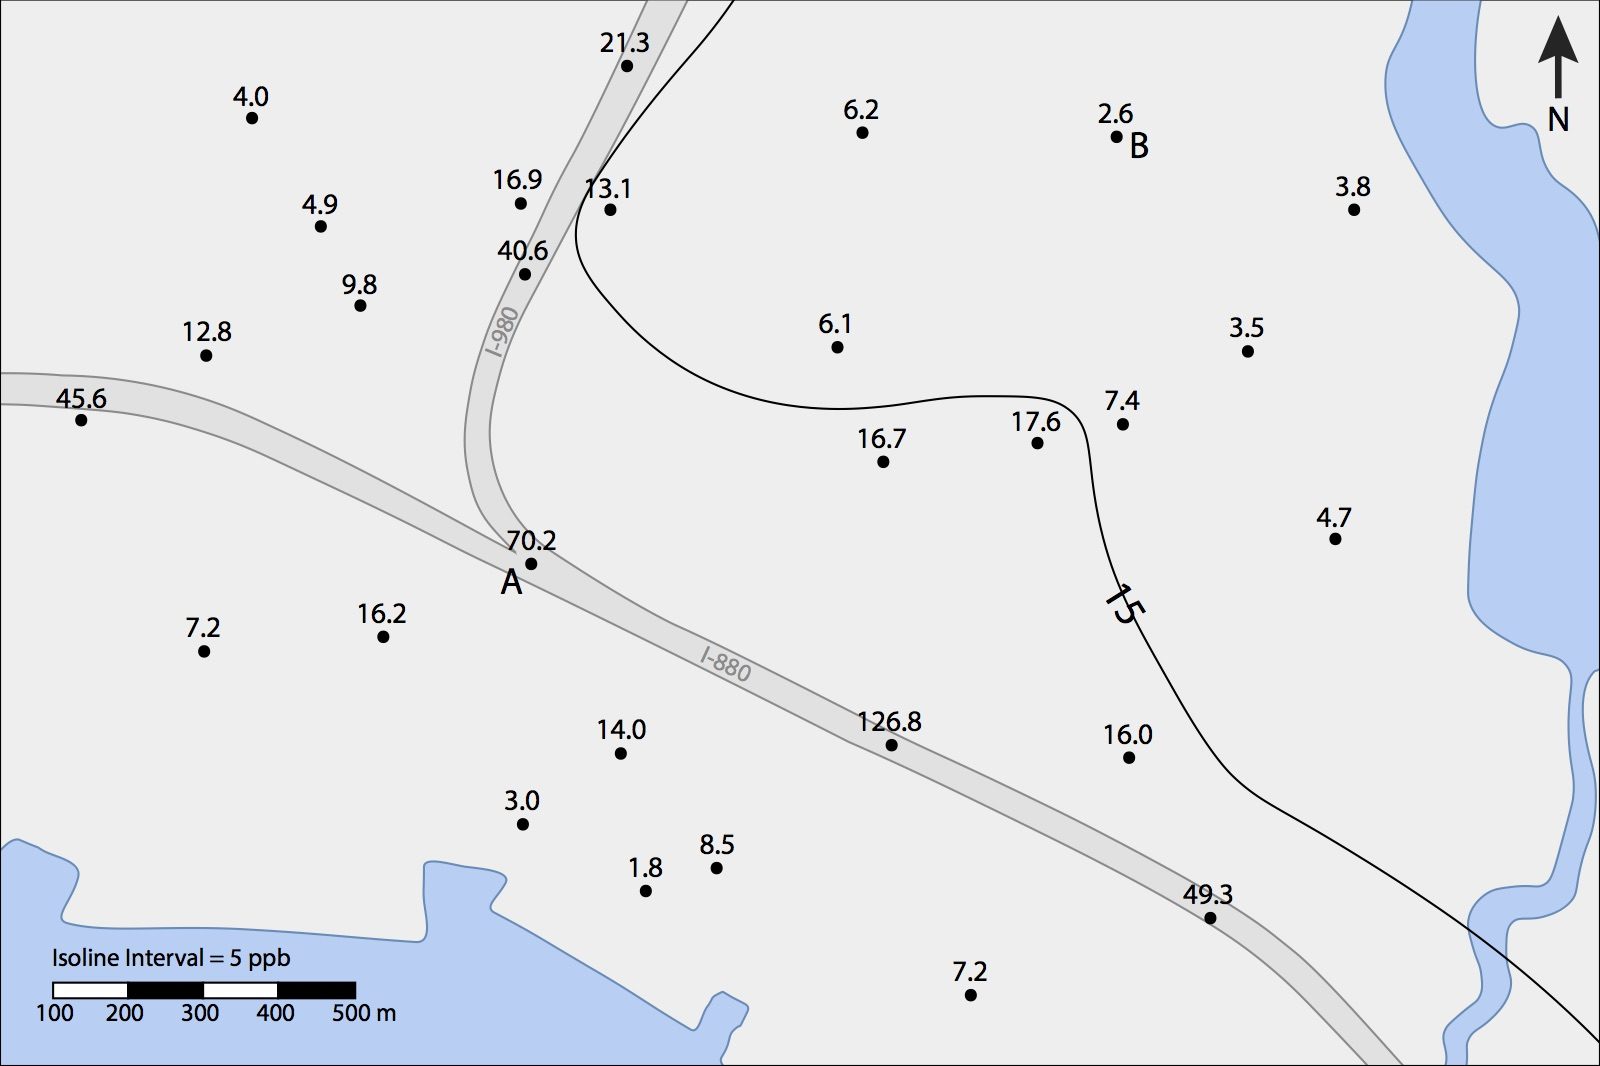
In this NGSS-aligned lesson, students learn to make a heat map by drawing contour lines of air pollution in Oakland, CA …
Hold on while we process your new account. This may take up to 30 seconds
Sign in below to get access to all video content and additional resources