ACE Report: Really Old Climate and Climate Change
Open Google Doc of Really Old Climate and Climate Change
By Rebecca Anderson, ACE Director of Education
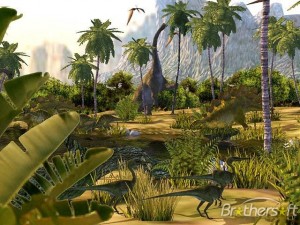
This topic was spurred by several questions from ACE educators during a science training session. Many were interested in what climate was like a really long time ago (back in the Age of the Dinosaurs) and in how we could ever possibly know this.
Let’s start with the big picture: a graph of CO2 and temperature over the last 600 million years
Black line – CO2
Blue line – temperature
Time goes forward left to right (today is at far right).
Check out how today’s CO2 and temperature are some of the lowest values the Earth has seen in the past 600 million years. We are living in an Ice Age world – just during a brief respite from the cold for the last 10,000 years.
Why? Primarily because of where the continents are right now – lots of land located near the poles that provides a starting point for big ice sheets to grow. Then that albedo feedback kicks in and works to keep the ice there and the world cool.
(Albedo means how reflective a surface is. White snow and ice reflects sunlight, so they have a high albedo. More reflected sunlight equals less sunlight being absorbed by Earth, which in turn makes the Earth cooler and allows even more snow to stick around. This is called a positive feedback.)
If you go even further back in time, 500-600 million years ago, CO2 was even higher – maybe even as high as 7000 ppm! (Although I did see other values for this time that were more like 2000-3000 ppm.)
One cool thing I learned is that the cause for the big drop in CO2 from those way high values was the evolution of big plants on land. These big plants sucked lots of CO2 out of the atmosphere through photosynthesis, as well as helping to break down soil and rock and increase weathering, which also sucks CO2 from the atmosphere. Pretty wild!
But then CO2 increased again during the dinosaurs’ time. The main reason for this is that the mid-ocean ridges were spreading and pushing up new rock at a much faster rate than today, which also brought up a lot of CO2 to the surface as well.
This begs another question: How can people ever know this stuff, if it happened SO long ago??
I have to say, it is pretty amazing that we have figured out how to look back in time and imagine what the world was like back then. But “imagine” or better yet, “estimate” is the key – it’s really hard to get precise numbers on what temperature or CO2 was hundreds of millions of years ago. (Maybe it was 7000 ppm…? Or maybe it was closer to 2000 ppm…)
So that’s something important to keep in mind – there’s a LOT of uncertainty in these estimates.
That being said, here’s how scientists come up with these numbers:
CO2
This is done with models that include the whole big carbon cycle and estimate how much carbon was in rocks, plants, ocean, soil and atmosphere and the fluxes between them. This is based on things like the position of the continents, what mountains were being built and eroded, how many plants were on land and then compared to today’s numbers. Lots of wiggle room here!
Temperature
General climate can be recreated by mapping out ancient deposits such as coal, palm trees, alligator fossils (All found in a warm and wet climate.) or desert sands (dry), or deposits from a glacier (cold). These plant and animals fossils and the type of rocks all give information on what the climate was like when they were formed. Here’s a cool website that gives maps of these deposits (as well as positions of the continents) all through geologic time.
More exact information on temperature can come from leaf fossils – particularly the ratio between leaves with smooth edges and those with “toothed” edges. It turns out that the ratio of leaves with smooth vs. toothed edges gives a really good estimation of temperature. (This is called a proxy.) This can be matched with real temperatures today and then projected back to come up with temperatures in the past.
Check out how well this ratio of smooth vs. teeth in modern leaves (from Wolfe, 1979) correlates with temperature! Isn’t that cool!?!? (“Entire margins” means smooth edges.)
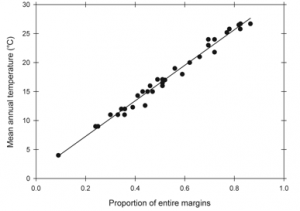
It turns out that’s it’s not well understood exactly why leaf edges and temperature are so well-correlated. The best explanation I came across is that more teeth are better in colder climates because they allow for more photosynthesis and transpiration early in the growing season. Something about having more area along the margins for these reactions to take place… Interesting that there’s a whole science based on using this correlation to predict past temperatures, but no one’s really sure why it works so well.
REALLY Old Climate and Climate Change
Student Worksheet
Name:
1. What was the CO2 concentration during the Mesozoic Era – the Age of Dinosaurs?
2. What was the temperature?
3. What was the cause for the big drop in CO2 between 500 and 300 Mya (million years ago)?
4. The CO2 concentration went down (due to the above) and then back up again at the end of the Paleozoic (about 250 Mya). What do scientists believe caused this?
5. What is a positive feedback? Give an example.
6. Name three clues scientists use to determine CO2 concentration before humans were around. HINT: It’s all based on one thing… what is that?
7. Name three things scientists use to estimate temperature from millions of years ago.
8. We use ice core data to understand both CO2 concentration and temperature for the last 800,000 years. Where is this time period on the graph?
9. What does proxy mean? Give an example.